
Blog
I Audited My Own Coursework. A Lookup Table Won.
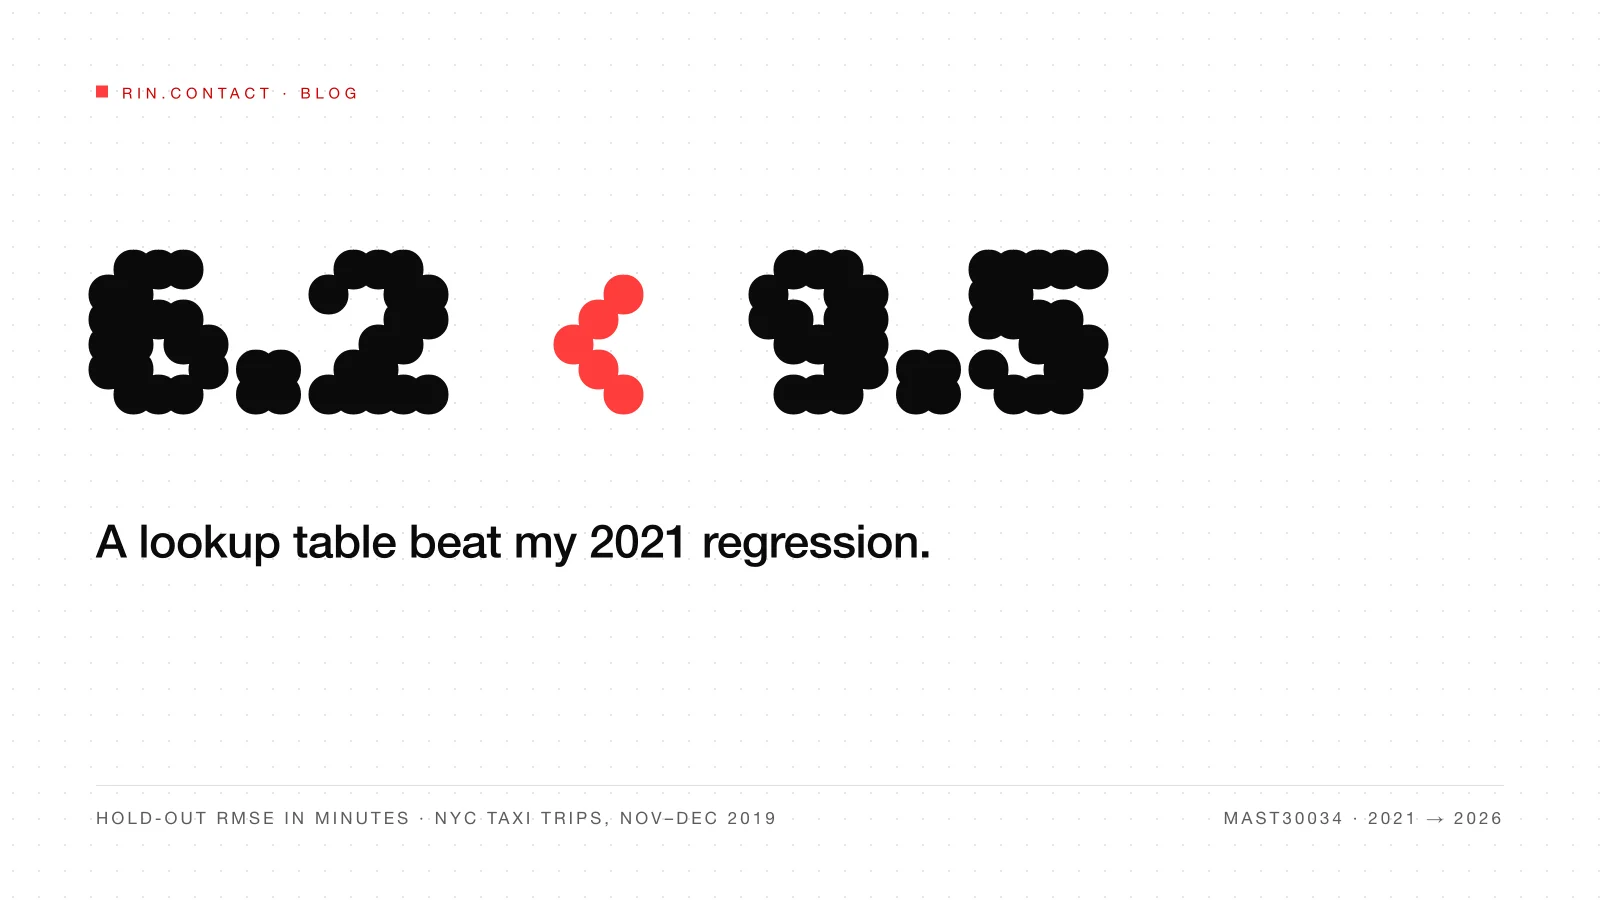
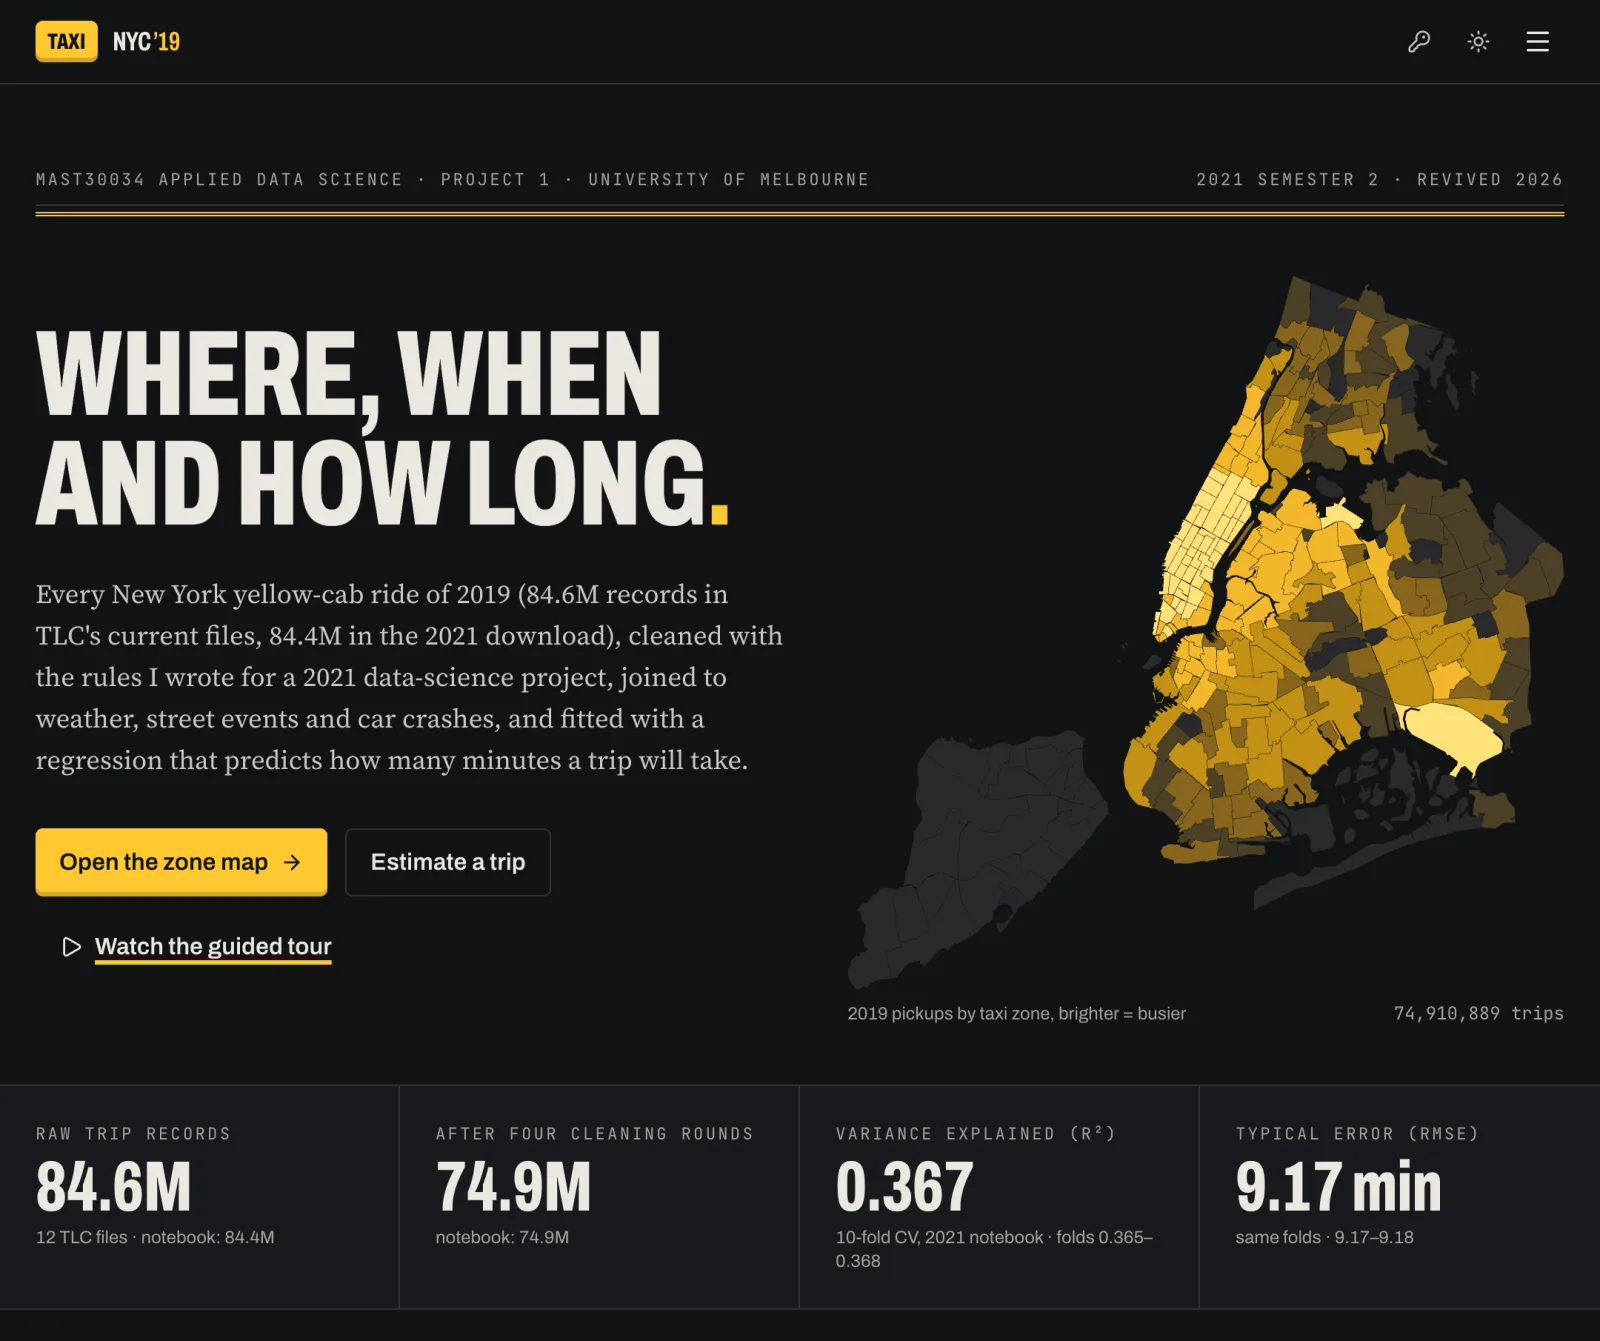
In 2021 I fitted a regression to predict how long a New York taxi trip would take. It was the centrepiece of my Applied Data Science project. I cleaned more than 84 million trips, joined them to weather, street events and car crashes, and trained the model in PySpark. The notebook reported an error of 9.17 minutes under 10-fold cross-validation, and I took that as the answer.
This year I rebuilt the project and tested it the way I would test a model at work. I trained on January to October 2019, held out November and December, and compared the model with the plainest baseline I could think of. For each pickup zone, drop-off zone and hour of the day, the baseline predicts the median trip time from the earlier months. It is a lookup table with no learning in it.
The lookup table won.
On the same hold-out trips, the lookup's error was 3.23 minutes lower, with a paired 95% confidence interval of 3.10 to 3.34 minutes. Sampling noise cannot explain a gap that size.
The reason was sitting in my own model specification. My regression added a pickup-zone effect to a drop-off-zone effect. Neither term knows how far apart the two zones are, so a short hop between neighbouring zones and a long ride across the city can look much the same to the model. The lookup table gets distance for free, because every route has its own row.
I explained why I went back to my coursework in a LinkedIn post this week. This post is about what I found when I did.
How the audit worked
I rebuilt nineteen projects from 2019 to 2024, from first-year Python through to master's subjects in statistics and machine learning. Every one followed the same three steps, in the same order.
The order mattered more than anything else. Before I was allowed to question a 2021 result, the rebuilt version had to reproduce it. Parity tests compared the new TypeScript with my original Python, C or R, and the build failed if a number drifted. For the source separation assignment, matching my old figures meant porting NumPy's legacy random number generator bit for bit, so the browser could regenerate the exact noise I had simulated in 2021. For the Bayesian assignment, it meant porting parts of R's random number generator and its numerical integration.
That sounds like overkill for a portfolio. It is what made the re-checks fair. When the lookup table beat my regression, I knew I was comparing it with the model I actually submitted, and not with a version I had improved or broken by accident along the way.
Where my original code had a bug, I kept it and documented it. Several labs have an "as submitted" mode next to a corrected one, so anyone can compare the two.
What I got wrong as a student
The taxi result was the most visible one. It was not the only one.
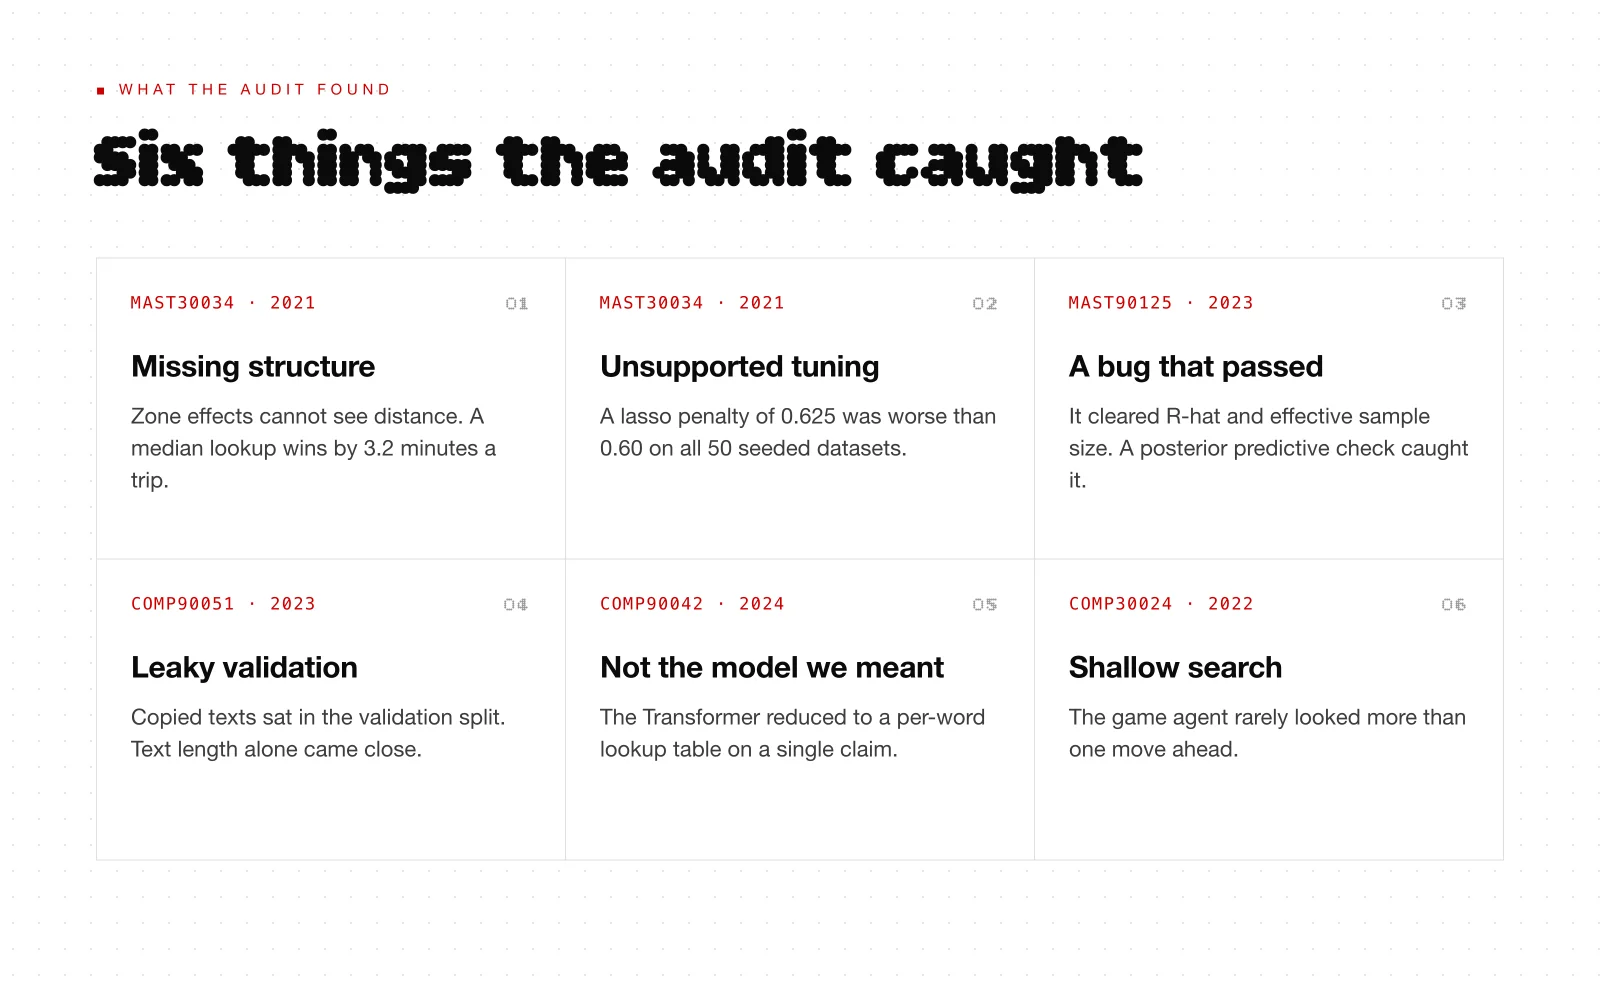
- I chose a tuning value the evidence did not support. In the source separation assignment I picked a lasso penalty of 0.625 from an error curve averaged over ten simulated datasets. Re-tested on 50 seeded datasets against a value fixed in advance, 0.625 gave about 10% higher error than 0.60 and was worse on all 50.
- A bug passed every convergence check. My 2023 Bayesian logistic regression had five bugs in the data encoding and the likelihood. One of them survived R-hat and effective sample size, the standard checks that a sampler has converged. Only a posterior predictive check, which compares simulated data with the real data, exposed it.
- Our validation split leaked. Re-checking our 2023 human-versus-machine text detector found copied machine-written texts in the validation split. On a clean split the detector still separated the classes well, but a baseline that only looks at text length came close.
- Our model was quietly something else. In our 2024 climate fact-checker, the Transformer mixed information across the claims in a batch instead of across the words in a claim. On a single claim it reduced to a per-word lookup table. Retrieval found the right evidence for only 13 of the 154 development claims.
- Our game agent hardly searched. A 1,200-game tournament showed that our 2022 agent rarely looked more than one move ahead, and a one-line bug stopped alpha-beta pruning from narrowing its window.
Three of these were team projects, so the mistakes were ours together, and so was the original work. Yifei Du and Huihui He were on the text detector, Xuan Wang and Wei Zhao on the fact-checker, and Wei Zhao on the game agent.
The new checks needed checking too. A coverage simulation on the first-year card game lab showed that my 2026 bootstrap intervals ran narrow on small samples. The default sample went up to 30 hands, and those intervals are now labelled as nominal.
Working with AI on it
I did this with Claude, and I want to be accurate about who did what. The AI wrote most of the porting code and ran the re-checks far faster than I could have alone. Most of my time went on deciding what a fair comparison looked like and on reading results I did not expect.
Two habits did most of the work. When a rebuilt number did not match the original, we treated the mismatch as information and chased it down. It usually pointed at a real difference, such as a random number generator, a library default or a notebook that did not match the code behind the report. When a conclusion surprised me, I asked for the baseline and the paired comparison before I believed it. The lookup table result went through both.
I wrote about where the skill moved in What AI Didn't Automate. This audit made that argument concrete for me. The AI lowered the cost of rebuilding and re-testing nineteen projects. Choosing which comparison was the honest one stayed with me, and so did the discomfort of watching my 2021 model lose to a median.
What I would tell my student self
Fit the simplest baseline first, and write down what it scores before you build anything clever. My regression may have been a reasonable choice in 2021, but I had no way to know, because I never measured it against a lookup table. A cross-validated error of 9.17 minutes sounded precise. It said nothing about whether 9.17 was good.
Keep a held-out set you do not look at, and split it by time when the data arrives over time. Run a predictive check even when the convergence diagnostics look clean. When a validation score looks too good, check the split before you celebrate the score.
Keep the original as well. The most useful part of this project was being able to put my 2021 output next to my 2026 output and see exactly where they differ. A solid foundation is what let me spot the wrong answers, including the ones I wrote myself.
All nineteen labs are live, each with its original code, the re-checks and a guided tour: University coursework, revived.
Read next
What AI Didn't Automate
AI took the repetitive execution off the table. It didn't touch theory, strategic judgement, or the ability to write a clear sentence. That is where the actual skill moved.
A Trend Line Is Not a Trend
Drawing a line through some points always produces a trend. Whether that movement is real, or just noise dressed up as a finding, is a separate question, and the one that should decide whether anyone acts on it.